
Applications
EXPLORE

ASPECT Applications
Methods, recipes and workflows
for climate information
FILTERS
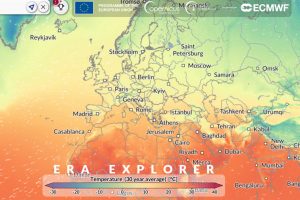
Description: the ERA Explorer is an intuitive, web-based climate data visualisation tool that provides interactive access to historical global ERA reanalysis datasets. It enables users to explore key climate variables, such as temperature, precipitation, and wind, through an easy-to-use interface with map-based navigation and search functionality. Users can investigate climate trends by location, time period, or variable, making the tool suitable for both quick exploration and more detailed climate analysis.
Example Use Cases:
- Compare warming trends between two cities.
- Examine long-term changes in average precipitation across decades.
- Download climate summaries for reporting or further analysis.
- Reproduce and extend analyses programmatically using Python.
Data provider: Copernicus Climate Change Service (C3S), implemented by ECMWF (ERA data)
Data provider: CMCC, ECMWF, MET OFFICE
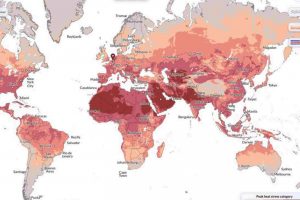
Description: Thermal Trace is an interactive web application for exploring global heat and cold stress data. It provides map- and chart-based visualisations of feels-like temperature and associated thermal stress categories. The application includes historical records from 1940 to approximately five days before the present, enabling users to examine both recent events and long-term changes. Thermal Trace supports the analysis of heatwaves, cold spells, and evolving patterns of thermal stress, offering valuable insights into the frequency, intensity, and geographical distribution of thermal stress worldwide.
Example Use Cases: Thermal Trace can be used to address questions such as:
- Where has extreme heat stress been observed in recent days?
- What was the highest feels-like temperature recorded during heatwaves in the last summer season?
- What was the lowest feels-like temperature recorded during cold snaps in the last winter season?
- How many days of very strong heat stress occurred during the month of my birth?
- How has the average number of heat stress days changed when comparing recent years to earlier decades?
- How is the frequency of cold stress days evolving over time?
Data provider: Copernicus Climate Change Service (C3S), implemented by ECMWF (ERA data)
Description:
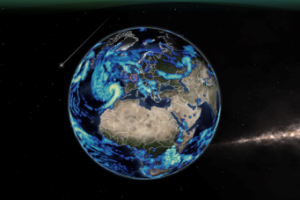
Weather Replay is an interactive web application that allows users to explore past weather conditions anywhere in the world, hour by hour, using ERA5 reanalysis data. It provides access to historical weather information from 1940 onwards, enabling users to revisit specific dates, locations, and weather events through an intuitive visual interface. The tool is useful for investigating past weather conditions, understanding historical events, and exploring how temperature, precipitation, wind, and other variables varied over time.
Example Use Cases: Thermal Trace can be used to address questions such as:
- Revisit the weather conditions on a specific historical date or personal milestone.
- Explore how weather evolved hour by hour during a past storm, heatwave, cold spell, or heavy rainfall event.
- Compare weather conditions between different locations on the same day.
- Investigate historical temperature, precipitation, or wind patterns for a selected place and time.
- Use past weather information to support education, storytelling, reporting, or event analysis.
Data provider: Copernicus Climate Change Service (C3S), implemented by ECMWF (ERA data)
Description:
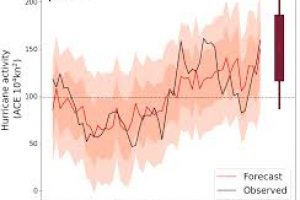
The Catalogue of Decadal Prediction is a Shiny-based web application for exploring graphical products from multiple decadal prediction models. It provides map- and chart-based visualisations of key climate variables, including temperature, precipitation, and pressure. The application includes ensemble mean anomalies, most-likely tercile categories, and associated skill metrics, allowing users to assess forecast signals, compare model outputs, and evaluate forecast performance across regions, variables, and time periods.
Example use cases:
- Assess forecast quality for a selected variable, region, or time period.
- Explore how decadal forecast signals evolve over time.
- Compare outputs and skill across different decadal prediction models.
- Examine ensemble mean anomalies for temperature, precipitation, or pressure.
- Identify regions where forecasts show stronger or weaker predictive skill.
Data provider: BSC, CMCC, MET OFFICE, ECMWF
Description:
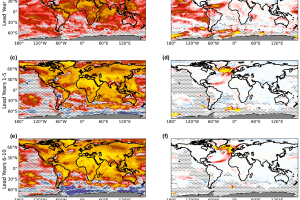
The Catalogue of Seasonal to Decadal Prediction is a Shiny-based web application for exploring and evaluating climate predictions across multiple time horizons, from seasonal to multi-annual and decadal timescales. It brings together graphical products from a range of state-of-the-art climate prediction models in a unified environment. The application provides maps and charts showing ensemble mean anomalies, probabilistic forecasts such as most-likely tercile categories, and associated skill metrics. It is designed to support the comparison, assessment, and merging of forecasts across different prediction horizons.
Example use cases:
- Assess forecast quality for a selected climate variable, region, or time horizon.
- Explore how seasonal, multi-annual, and decadal forecast signals evolve over time.
- Compare forecast products across different models and prediction timescales.
- Examine ensemble mean anomalies, probabilistic forecast categories, and skill metrics.
- Investigate whether combining seasonal, multi-annual, and decadal predictions can provide more robust climate information for users.
Data provider: BSC, CMCC, MET OFFICE, ECMWF